
Network visualization refers to the process of producing and showcasing graphical representations of network devices, metrics, and data flows. Simply put, it represents the visual aspects of network management and analysis. Numerous forms of network visualization exist, including network maps, graphs, charts, and matrices. In the realm of IT networks, network management software often comes equipped with built-in network visualization features.
If you’ve ever found yourself in a situation during a Zoom or Teams call where sharing your screen was the easiest way to communicate your point, you’ll appreciate the benefits of network visualization. This practice embodies the sentiment, “a picture is worth a thousand words,” within our industry.
Network visualization enables administrators to rapidly and intuitively assimilate extensive information about the network’s state. For instance, a network map can deliver a comprehensive topology overview, elucidating both physical and logical data flows. Charts and graphs that depict network data over time are instrumental in identifying trends and facilitating capacity planning. Matrices and network topology maps can unveil dependencies crucial for troubleshooting and resolving outages or bottlenecks.
Let’s delve deeper into the core benefits of network visualization:
Enhanced Network Visibility: Network topology maps offer complete visibility into your entire network, enabling you to comprehend the network architecture and device dependencies intricately. Dynamic network maps, unlike their static counterparts, automatically update when changes occur, often allowing for more detailed inspection of traffic flows and resource utilization.
Expedited Troubleshooting: Without visibility, problem-solving becomes an uphill battle. Network visualization techniques, like maps and performance graphs, provide the necessary visibility to streamline troubleshooting and root cause analysis efforts. For example, resolving a VoIP phone issue could be as straightforward as locating the device on your network map, identifying the connected switch port, and verifying that the port is correctly configured for the appropriate VLAN.
Informed Network Planning: When you understand your current network dependencies, inventory, and resource utilization trends, planning for network upgrades and refreshes becomes simpler. A tool that offers real-time network asset management, topology mapping, and historical network traffic data visualization equips you with the information you need to make informed decisions.
Efficient Onboarding: Speed and understanding new scenarios are two key components to effective onboarding in network roles. An accurate network topology map can expedite the process by providing a new network engineer with a comprehensive view of the network, detailing device and cable connections, both logical and physical. This approach is equally valuable if you’re a network administrator starting a new job, a seasoned admin navigating a company acquisition, or an MSP onboarding a new client. A network visualization tool equipped with topology mapping and network discovery functionalities can rapidly accelerate your efforts to learn about and document the network.
Improved Communication: Accurately and succinctly conveying complex information in a manner that customers, managers, and engineers can understand and act upon is a formidable challenge. The appropriate visuals can substantially enhance clarity, enabling you to address specific problems effectively.
Charts and Graphs
Charts and graphs excel at visualizing trends and comparing data sets. In terms of network visualization, there’s a plethora of charts and graphs that can aid in comprehending your network’s health. Metrics such as interface utilization, bandwidth, and packet loss can be graphed over time, while charts can compare metrics between devices, interfaces, or time periods.
Dashboards
To transform useful information into actionable insights, it must be easily accessible and digestible. While not a distinct type of network visualization, dashboards aggregate crucial data on a single page, simplifying the consumption of important information.
An custom-designed dashboard should be information-rich yet intuitive, allowing for a swift understanding of vital data. A default dashboard should provide information on open alerts, detected misconfigurations, and a graph of top device utilization among other metrics.
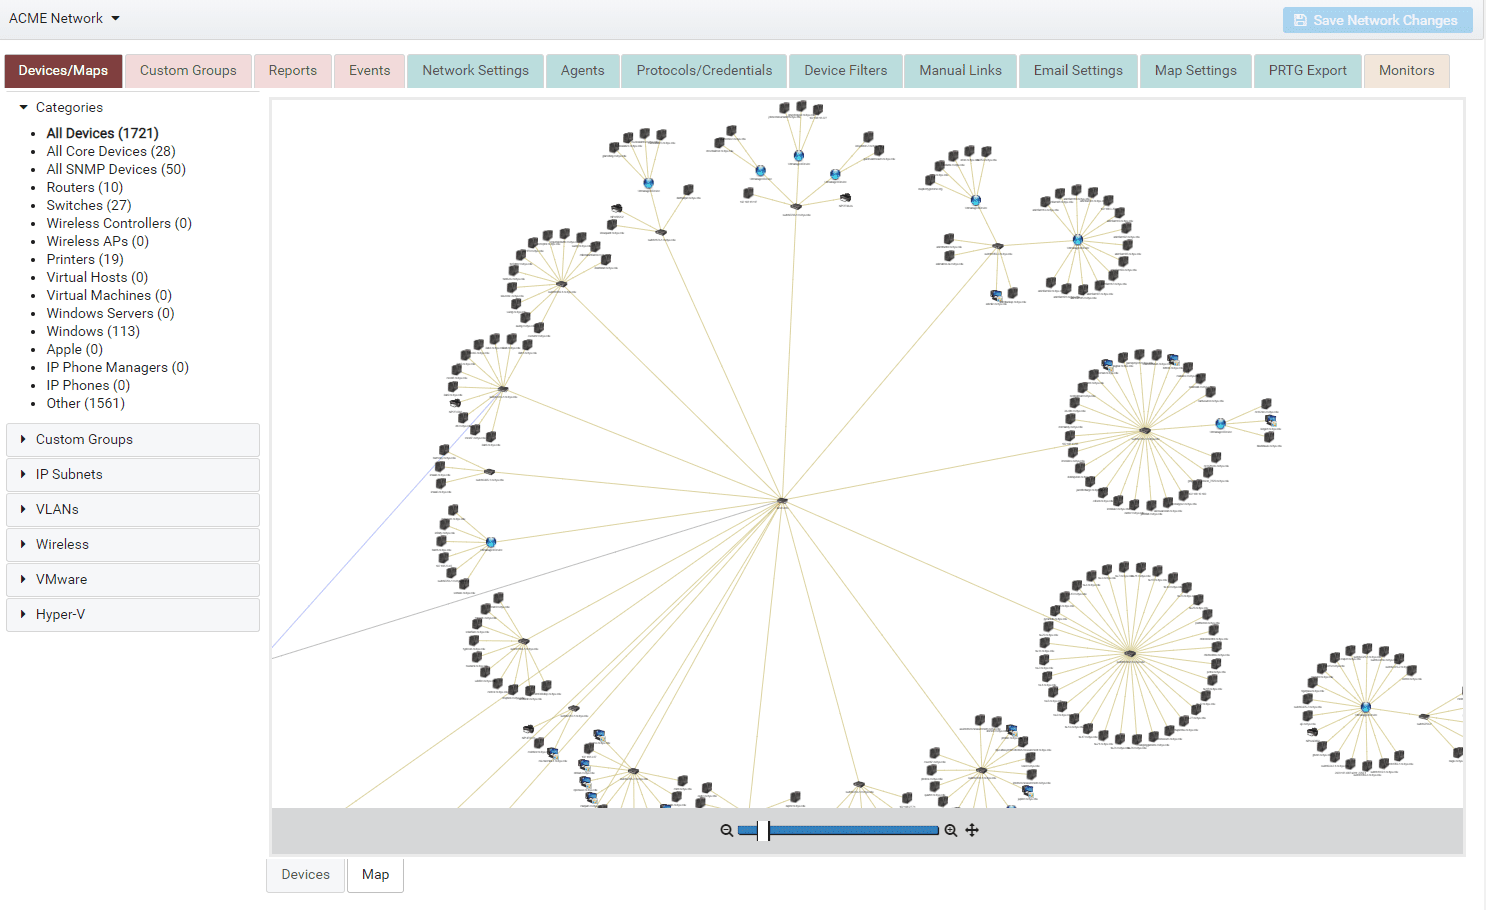
Network Maps
Network maps remain one of the most favored types of network visualization, and rightly so. The significance of network topology cannot be understated. Network maps enable visualization of your entire network topology, inclusive of specific devices, physical and logical connections, rack locations, and floor plans that constitute your network infrastructure. Broadly, network maps are categorized into two types: static network maps offering a fixed view of your network topology, and dynamic network maps reflecting near real-time changes.
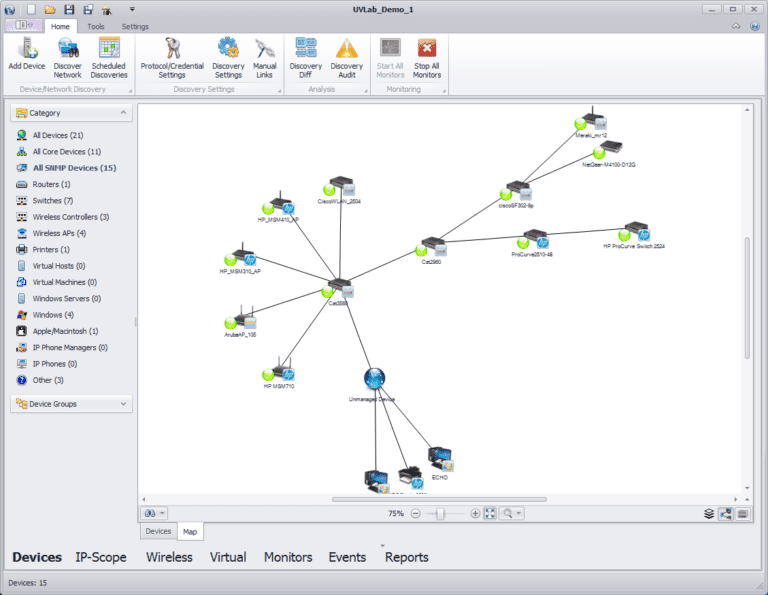
Static Network Maps
Also known as network diagrams, static maps can be manually created using tools such as Visio, or LucidChart.
Static network maps can also be generated by tools performing network discovery, such as UVexplorer. Coupling network discovery with network mapping presents the advantage of creating snapshots of a network’s actual state using the discovery functions.
For more options, our round-up of the top 5 network mapping tools may prove beneficial.
Dynamic Network Maps
Dynamic network maps incorporate real-time data on network changes. While static maps are beneficial for understanding the intended network design or the state of the network at a specific point in time, real-time network maps offer visibility into the current network state.
Typically, real-time dynamic network maps are interactive, allowing a drill-down to view specific metrics on connections, devices, and traffic flows. Given the automation of the discovery and visualization processes, dynamic network maps tend to offer more detail, eliminating the need to manually draw and detail the network diagram.
Network visibility solutions offering network discovery and dynamic network mapping prove far superior in troubleshooting, change management, and analysis than static maps requiring manual updates.
For beginners learning to implement network mapping, asset discovery and the creation of a dynamic network maps is generally an excellent starting point. A full featured discovery tool with network management tools will quickly enhance your troubleshooting efficacy. Additionally, if you’ve never previously had a comprehensive network map, you’re likely to gain new insights about your actual network topology. From this point, you can start focusing on specific business and performance objectives and the key performance indicators (KPIs) most relevant to you.
All Rights Reserved. UVnetworks © 2015 – 2025