UVexplorer can monitor your network and notify you when critical network services experience unexpected outages or performance problems. As an IT administrator, you have limited “bandwidth” to watch over your IT infrastructure. UVexplorer can increase that bandwidth by intelligently monitoring critical IT resources while you tend to more pressing issues.
UVexplorer provides the following types of monitors:
Ping and Latency monitors
Service / TCP Port monitors
CPU Load monitors
Disk Utilization monitors
Custom SNMP & WMI monitors
SNMP bandwidth monitors
DNS monitors
Web Site (HTTP) monitors
UVexplorer will give you visibility into the current state of your network, and alert you about areas of trouble.
Creating a Monitor
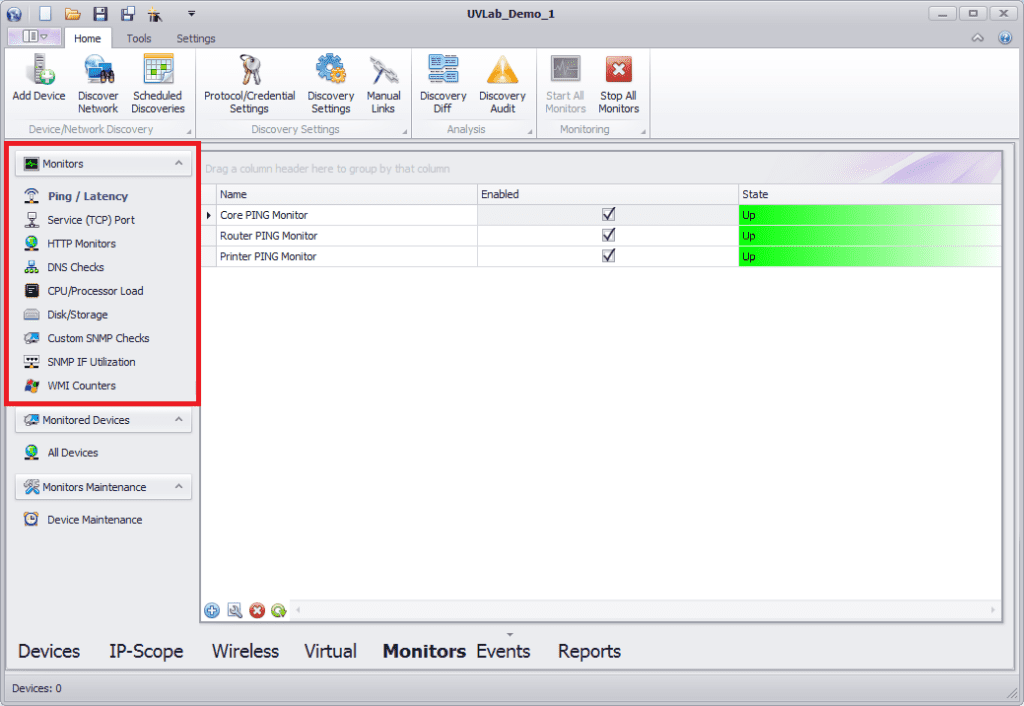
To manage your monitors, click on the Monitors tab along the bottom of UVexplorer’s main window. On the left side there is a list displaying the various types of monitors you can create (Ping/Latency, Service Port, HTTP, etc.) Click on the type of monitors you are interested in. (In the image below, we selected Ping/Latency monitors). The name, enable status, and current state of each monitor is displayed in the grid on the right side.
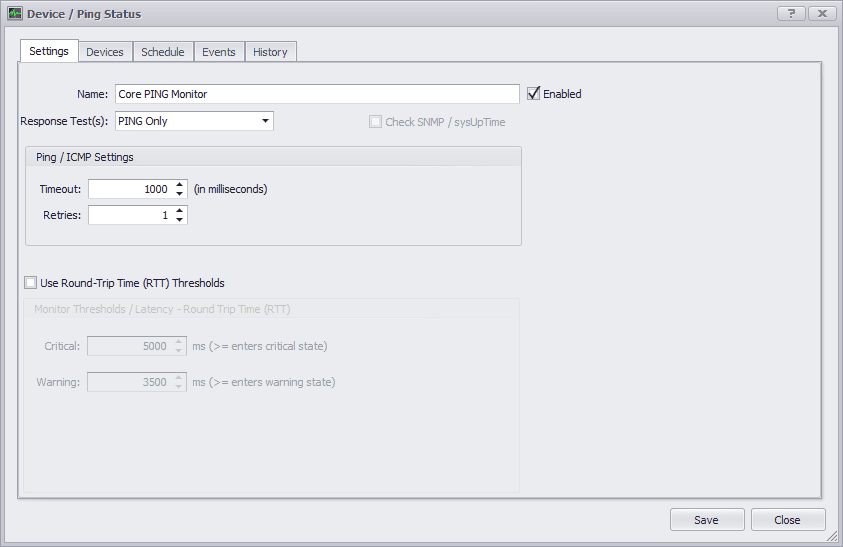
To create a new monitor, right-click on the list of monitors, and select Add from the context menu. This will display a monitor configuration form. This form lets you specify the various Settings for the monitor, select the Devices to which the monitor applies, and define the Schedule that specifies when the monitor should run. (The image below shows the Settings for a Ping/Latency monitor.)
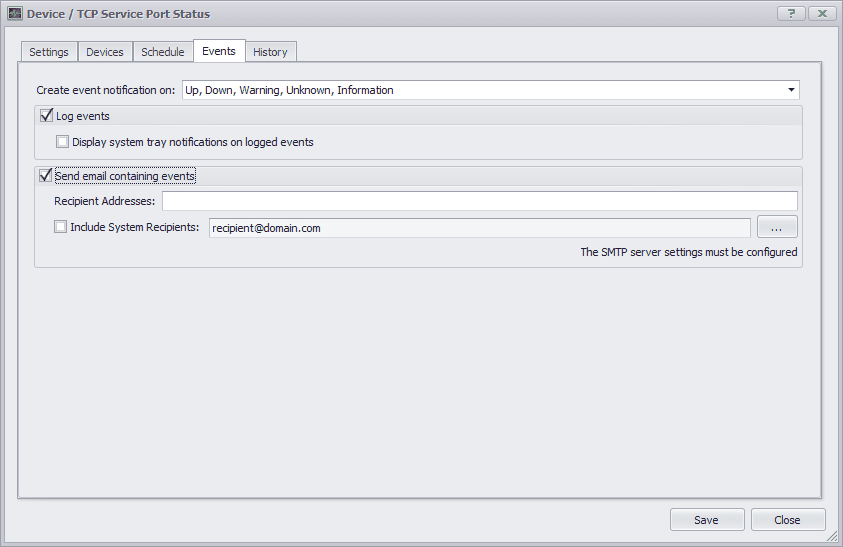
You can also define what events related to the monitor should be logged, emailed, and/or displayed on the desktop. (See the image below.) You can also specify how much historical data should be kept for the monitor in UVexplorer’s database.
Viewing Monitor State
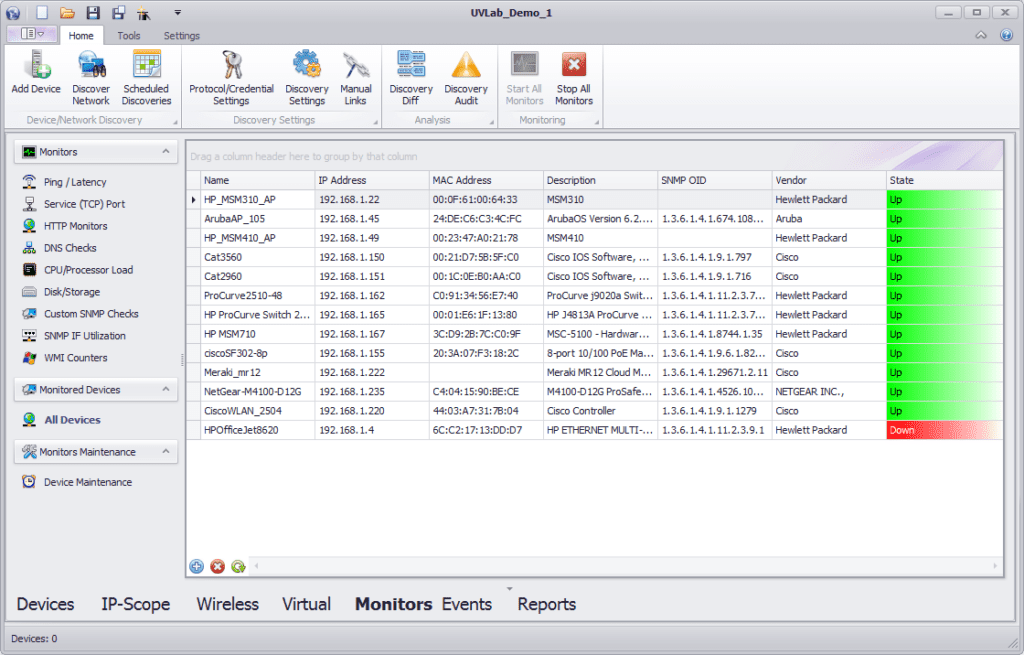
Monitoring is all about watching the states of the devices and services on your network, and being notified when something interesting occurs. Each device participating in a monitor has a current state relative to that monitor (Up, Down, Warning, Paused, etc.). Similarly, the monitor itself has an overall state, which is a combination (i.e., “roll-up”) of all the states for the various devices in the monitor. Furthermore, each device also has an overall state, which is a roll-up of all that device’s states for all monitors in which it participates. (For example, a device might participate in a Ping monitor and a CPU monitor. The overall state for that device would be a combination of the states for its Ping monitor and its CPU monitor.) The current states for monitors and participating devices are displayed in various places in the UVexplorer user interface. For example, clicking “All Devices” on the left side of the Monitors tab displays a list of all devices that have monitors on them. The grid on the right displays details about each device, including its current overall monitoring state (Up, Down, Warning, Paused, etc.) (See the image below.)
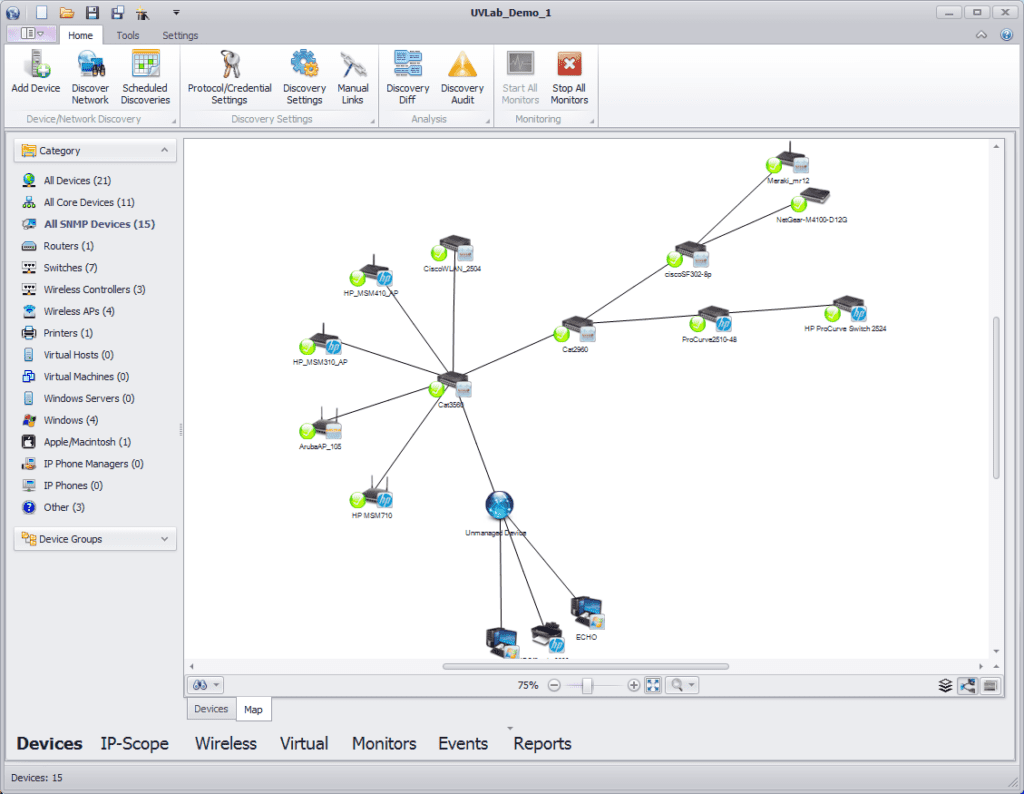
Overall device state is also displayed on UVexplorer’s network maps. The icon for a device is decorated with a colored symbol that indicates its current monitoring state (Green = Up, Yellow = Warning, Red = Down, Blue = Paused, etc.). (In the image below, you can see that all devices being monitored are in the Up state, because they are green.)
UVexplorer provides several other ways to view monitor and device state that are not depicted here. (See the full product documentation for details.)
Viewing Monitor Events
Monitors allow you to be notified when important events occur in your network. Events of interest might include things like: a device is down, a device’s CPU usage has spiked, a device’s disk is getting full, a web site is down, an SNMP counter is out-of-range, etc.
Depending on a monitor’s configuration, UVexplorer does some or all of the following when an event occurs:
Displays the event in UVexplorer’s Events tab (select Events at the bottom of the window)
Sends an email to one or more system administrators
Displays a desktop notification on the Windows desktop
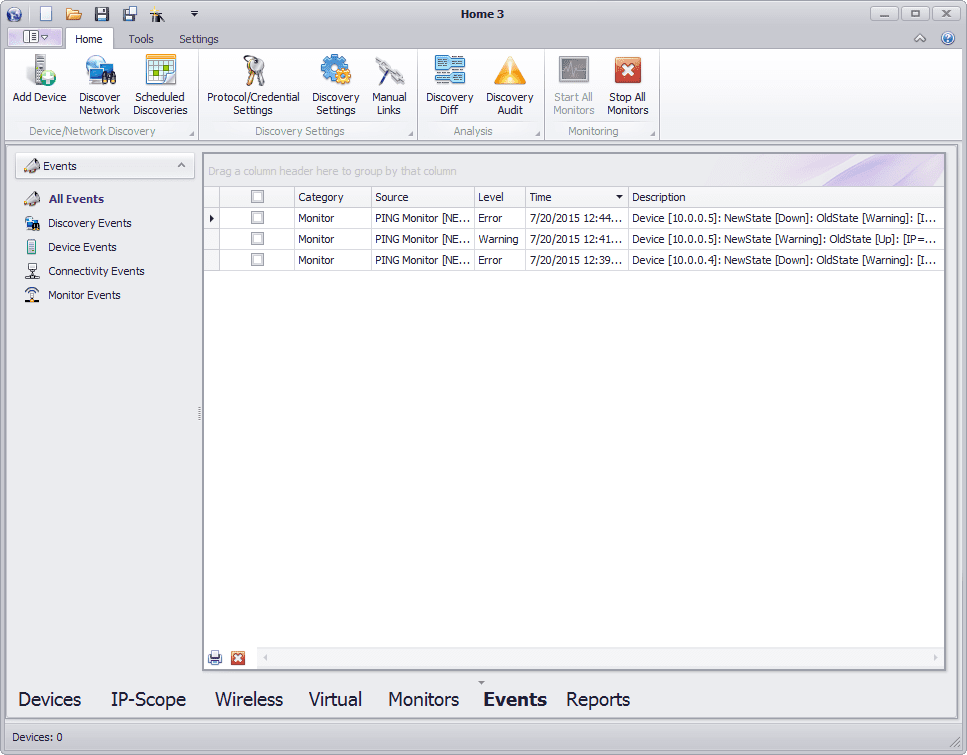
For example, the image below shows the Events tab displaying some Ping monitor events that indicate some devices on the network are having problems.
Viewing Monitor History
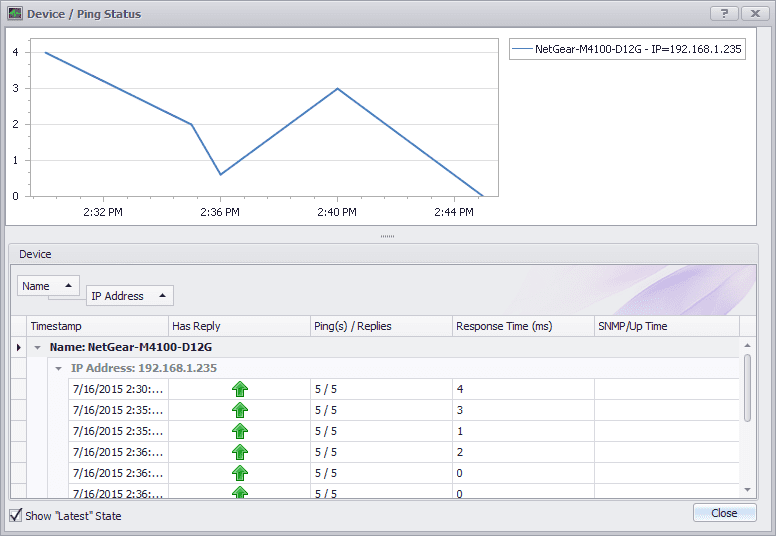
Monitors run periodically according to their defined schedules. Each time a monitor runs, it collects some kind of data or information that is then stored in UVexplorer’s database. For example, each time a Ping monitor runs, it sends several Ping requests to each device in the monitor. It records how many of those Ping requests succeed and how many fail, and also the round-trip time for each request. This data is used to determine the current state of each device and the monitor itself. It is often useful to view a history of the data collected over time for a monitor. This is useful for seeing historical trends in the performance of your network. For example, the image below shows the history for a Ping monitor. This particular Ping monitor is only monitoring one device. The graph displays the Ping response times for this device over time. The grid below shows more details about each Ping attempt.